
Strategies for Identifying Trending Stocks with Investlytic: A Practical Guide
Introduction: Surfing the Waves of the Market
Stock market investing can often feel like navigating the high seas. There are calm periods, stormy times, but most importantly, there are waves and currents that savvy investors seek to identify and follow. These "waves" are what we call market trends. Understanding and identifying a trending stock—whether it's rising, falling, or moving laterally—is a fundamental skill for any investor looking to optimize their timing, maximize their potential gains, and better manage their risks. For example, a rising trend suggests a positive dynamic where demand exceeds supply, pushing prices upwards. Conversely, a declining trend indicates dominant selling pressure. Knowing how to read these movements can make the difference between a fruitful investment and a disappointing loss.
But how do you detect these precious trends amidst the daily tumult of financial markets? This is where technology comes in. Analytical tools like Investlytic are designed to help investors, even novices, decipher these signals. This article aims to guide you step-by-step through the strategies for identifying trending stocks using the specific features of Investlytic. Together, we will see how this tool can become a valuable ally in your quest for superior stock market performance.
Chapter 1: Understanding Stock Market Trends – The Fundamentals
Before diving into the practical use of Investlytic, it is essential to have a clear understanding of what a stock market trend is and how it manifests.
What is a Stock Market Trend?
In simple terms, a stock market trend represents the general direction in which the price of an asset (such as a stock) or an entire market moves over a given period. We can draw inspiration from Dow Theory, one of the pillars of technical analysis, which generally distinguishes three types of trends based on their duration and magnitude:
- Primary (or major) trends: These are underlying movements that typically last from one year to several years. A primary uptrend is called a "bull market," while a primary downtrend is a "bear market."
- Secondary (or intermediate) trends: They represent corrections or rebounds within a primary trend. They usually last from a few weeks to several months. For example, within a large bull market, one might observe temporary phases of decline (secondary downtrends).
- Minor (or short-term) trends: These are shorter-term fluctuations, lasting from a few days to a few weeks. They are often more volatile and harder for long-term investors to interpret.
For our purposes, we will focus primarily on identifying primary and secondary trends, as these generally offer the most significant opportunities for individual investors.
The Different Types of Trends
Specifically, there are three main directions for a trend:
- Bullish Trend (Uptrend): It is characterized by a succession of higher and higher peaks and troughs. This indicates that buyers dominate the market and optimism prevails.
- Bearish Trend (Downtrend): Conversely, it manifests through lower and lower peaks and troughs. Sellers have the upper hand, and pessimism dominates.
- Sideways Trend (Range or Horizontal Trend): The price of the stock oscillates horizontally between a support level (floor) and a resistance level (ceiling), without a clear direction. Buyer and seller forces are more or less balanced. An exit from this consolidation phase can often mark the beginning of a new bullish or bearish trend.
How Do Trends Form?
Trends do not arise randomly. They reflect the collective psychology of investors and the complex interaction of many factors:
- The Psychology of Investors: Greed, fear, optimism, and pessimism are powerful drivers on the markets. A series of good news can generate optimism and attract buyers, creating a bullish trend. Conversely, fears can trigger massive selling.
- Information Flows: Corporate earnings reports, economic announcements (interest rates, inflation, unemployment), geopolitical events, technological innovations, or regulatory changes directly influence investor perceptions and thus prices.
- Fundamental Economic Factors: The overall health of the economy, the growth of a particular industry sector, the intrinsic performance of a company (its profitability, growth prospects, competitive position) are underlying elements that support or weaken trends.
Basic Technical Indicators to Identify Trends
Technical analysis offers a range of tools to visualize and interpret trends. Among the simplest and most commonly used are:
- Trend Lines: These are straight lines drawn on a price chart. For an uptrend, you connect at least two ascending lows. As long as the price remains above this line, the trend is considered intact. For a downtrend, you connect at least two descending highs.
- Moving Averages (MA): A moving average smooths out price fluctuations to highlight the underlying trend. It calculates the average price over a given period (for example, 20, 50, or 200 days). If the price is above its moving average and the average is rising, the trend is generally considered bullish. The opposite is true for a bearish trend. The crossover of moving averages of different periods (for example, a 50-day MA crossing above a 200-day MA) can also be interpreted as a signal of trend change.
Understanding these basic concepts is the first step towards effectively using a tool like Investlytic, which automates and simplifies part of this analysis for you.
Chapter 2: A Closer Look at Investlytic – Your Tools for Detecting Trends
Now that we have refreshed the basics on stock market trends, let’s see how Investlytic can actually help you identify and analyze them. This tool has been designed to simplify access to key financial information and present analyses intuitively, which is particularly useful when evaluating the dynamics of a stock.
The Key Features of Investlytic for Trend Analysis
Exploring Investlytic, especially through its individual stock analysis interface (the one we used with app.py), several features prove valuable for studying trends:
-
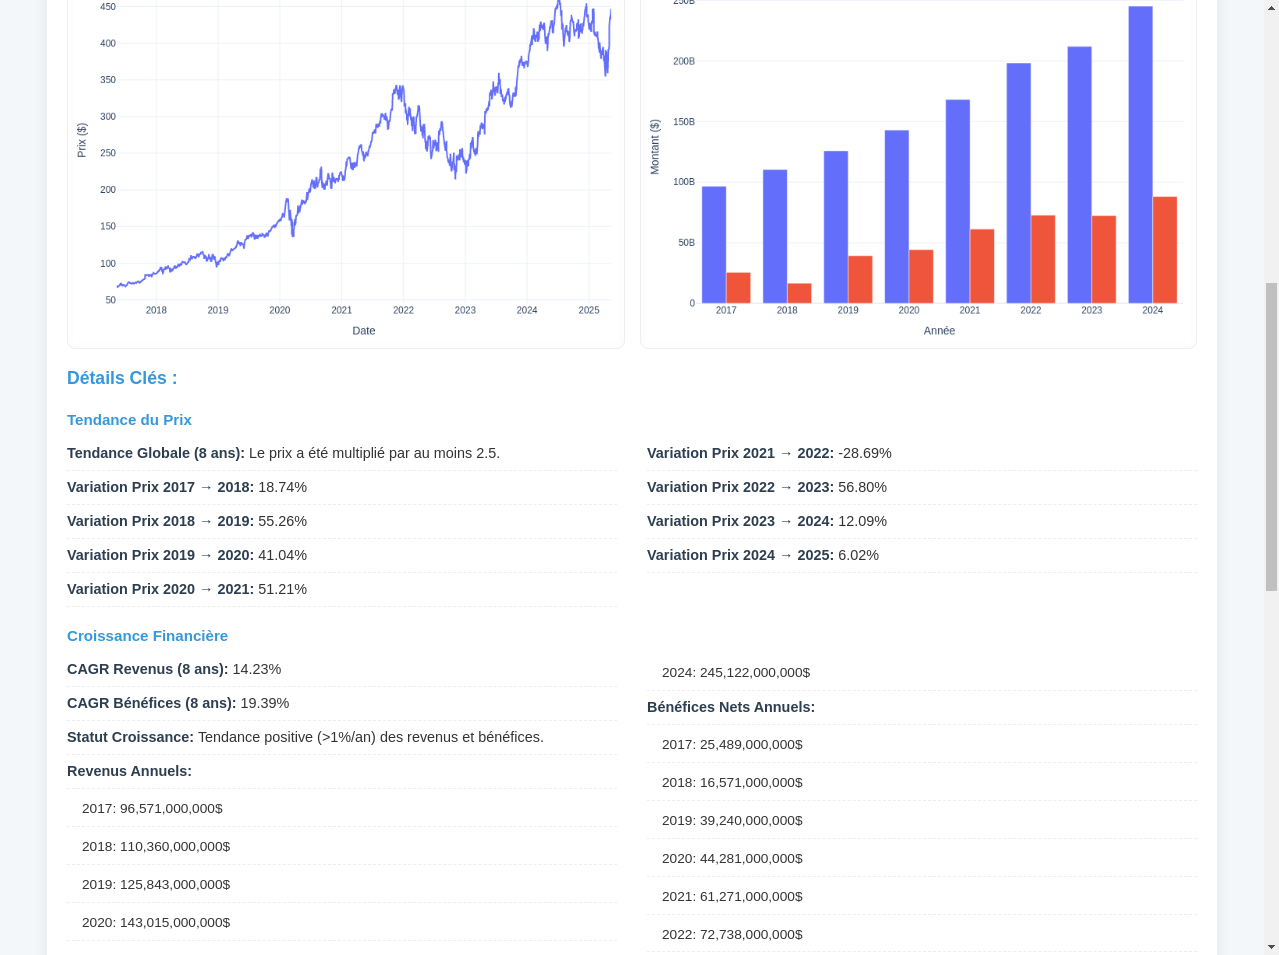
Long-Term Price Visualization: The tool displays a chart of the stock's price evolution over a significant period (for example, 8 years in the examples we were able to generate). This overall view is the first step to visually identifying the primary trend of the stock. An upward sloping curve from left to right indicates an uptrend, while a downward sloping curve signals a downtrend.
Calculation and Display of the “Price Trend Multiplier (8y)”: This is a central indicator in Investlytic to quantify the strength of the long-term trend. As we saw when analyzing the code (
app.py), this multiplier is calculated by dividing the latest stock price by its initial price over the considered period (8 years). For example, a multiplier of 2.5 means that the stock price has been multiplied by 2.5 over the last 8 years. The user can set a threshold for this multiplier (default is 1.5 in the interface). If the calculated multiplier for the stock is greater than or equal to this threshold, Investlytic considers that the criterion “Price Trend OK” is met.-
Details of Annual and Multi-Year Price Variations: In addition to the overall trend over 8 years, Investlytic breaks down the performance into price variations over shorter periods (for example, Price Variation 2017 → 2018, 2018 → 2019, etc., up to the most recent period). This allows one to see the regularity of the trend, identify years of acceleration, deceleration, or even corrections within the major trend.
-
Financial Growth Indicators (Revenue and Profit): Although these are not direct indicators of price trend, sustained growth in revenue and profit of a company is often the fundamental driver of a lasting upward trend in its stock price. Investlytic displays the CAGR (Compound Annual Growth Rate) of revenue and profit over 8 years, as well as annual figures. A positive "Growth Status" (for example, >1% per year) for both metrics reinforces the validity of an upward price trend.
-
Other Contextual Analysis Criteria: Investlytic also integrates thresholds for the Max P/E, Max Debt/Equity Ratio, and Min/Max Correction Ranges. While these parameters serve for a more global evaluation of investment opportunity, they can be used in conjunction with trend analysis. For example, a stock in a strong upward trend but with an excessively high P/E or too much debt might warrant caution.
Configure Investlytic for Trend-Focused Research
To use Investlytic specifically to identify trending stocks, here’s how you might approach setting the analysis parameters:
The "Multiplying Price Trend (8a)" as the Primary Filter: If you are looking for stocks that have demonstrated strong price growth over the long term, you can increase the threshold of this multiplier. For example, instead of the default 1.5, you could set it to 2.0, 2.5, or even higher, to highlight only those stocks whose prices have at least doubled or more over 8 years. Conversely, if you are seeking stocks that have not yet strongly risen (potentially early in a trend or coming out of a range), you could use a lower multiplier while observing other signals.
-
Analyze the Charts and Annual Price Changes: Once a stock is selected (or if you are analyzing a specific stock), pay particular attention to the 8-year price chart. Is the trend regular or erratic? Were there significant correction phases? Do the annual price changes confirm a steady progression or sporadic jumps?
-
Cross-reference with Fundamental Growth: Always check whether the price trend is supported by revenue and profit growth. A price trend that is not accompanied by an improvement in the company's fundamentals may be more speculative and therefore riskier.
By combining these observations, Investlytic offers a valuable first layer of analysis to identify stocks whose price dynamics warrant further investigation. The next chapter will illustrate this with practical examples.
Chapter 3: Practical Examples – Identifying a Trending Stock with Investlytic
Let’s move on to practice! This chapter will illustrate, through concrete examples, how to use Investlytic to identify and analyze trending stocks. We will base our examples on the functionalities we have explored and screenshots taken during our tool usage.
Example 1: Search for a Strong Uptrend Stock (Example: MSFT)
Imagine we are looking to identify a stock that has demonstrated solid long-term upward momentum. We will use Microsoft (MSFT) as an example, as it is known for its sustained growth.
1. Initial Setup and Search for the Stock:
- We launch Investlytic and access the stock analysis interface.
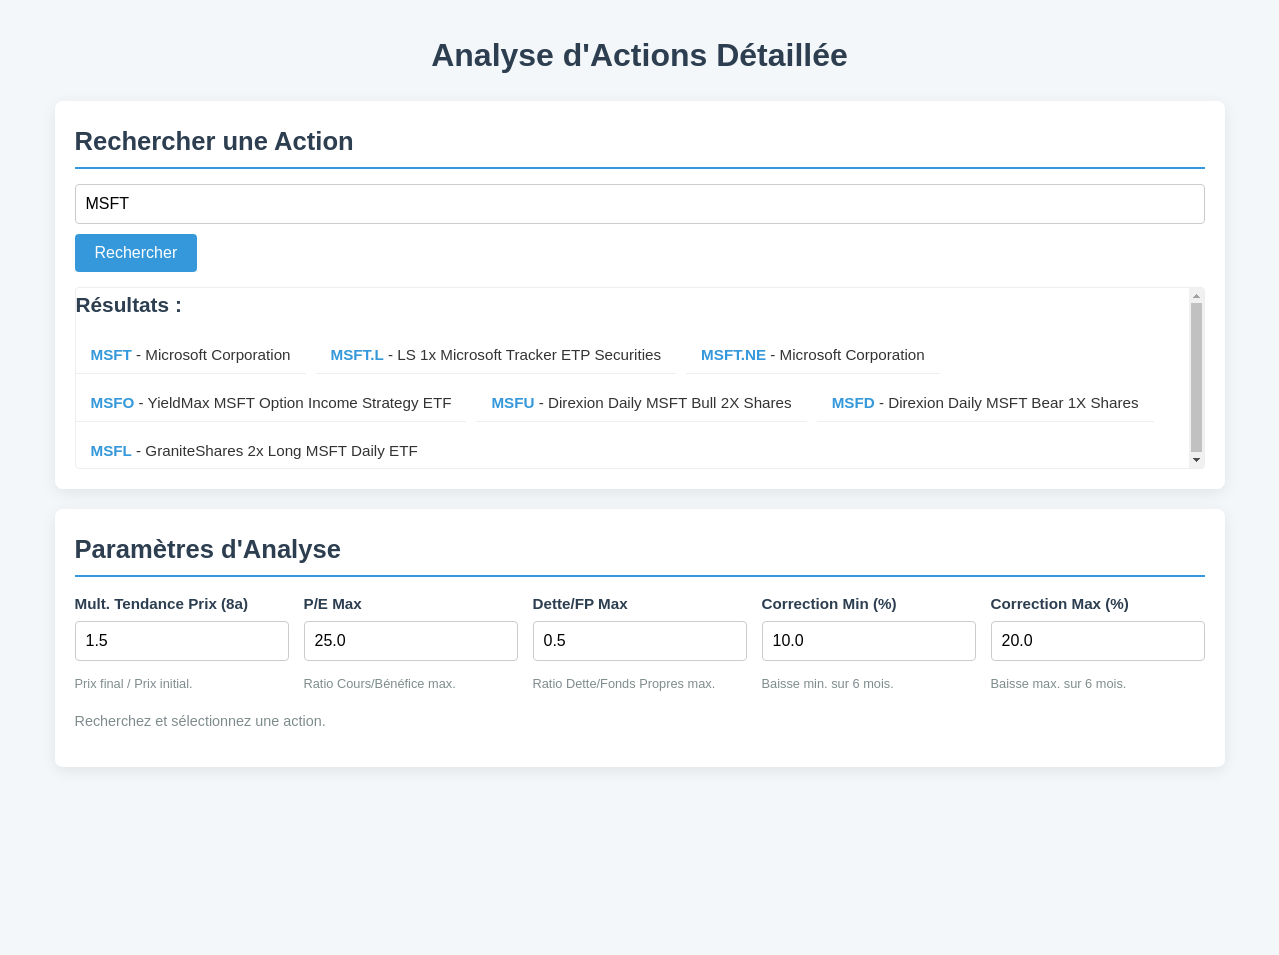
- In the search field, we enter “MSFT”.
- We click on “Search”. The tool then provides a list of matches. We select “MSFT - Microsoft Corporation”.
- The tool then loads the data for MSFT and displays an initial analysis based on the default parameters.
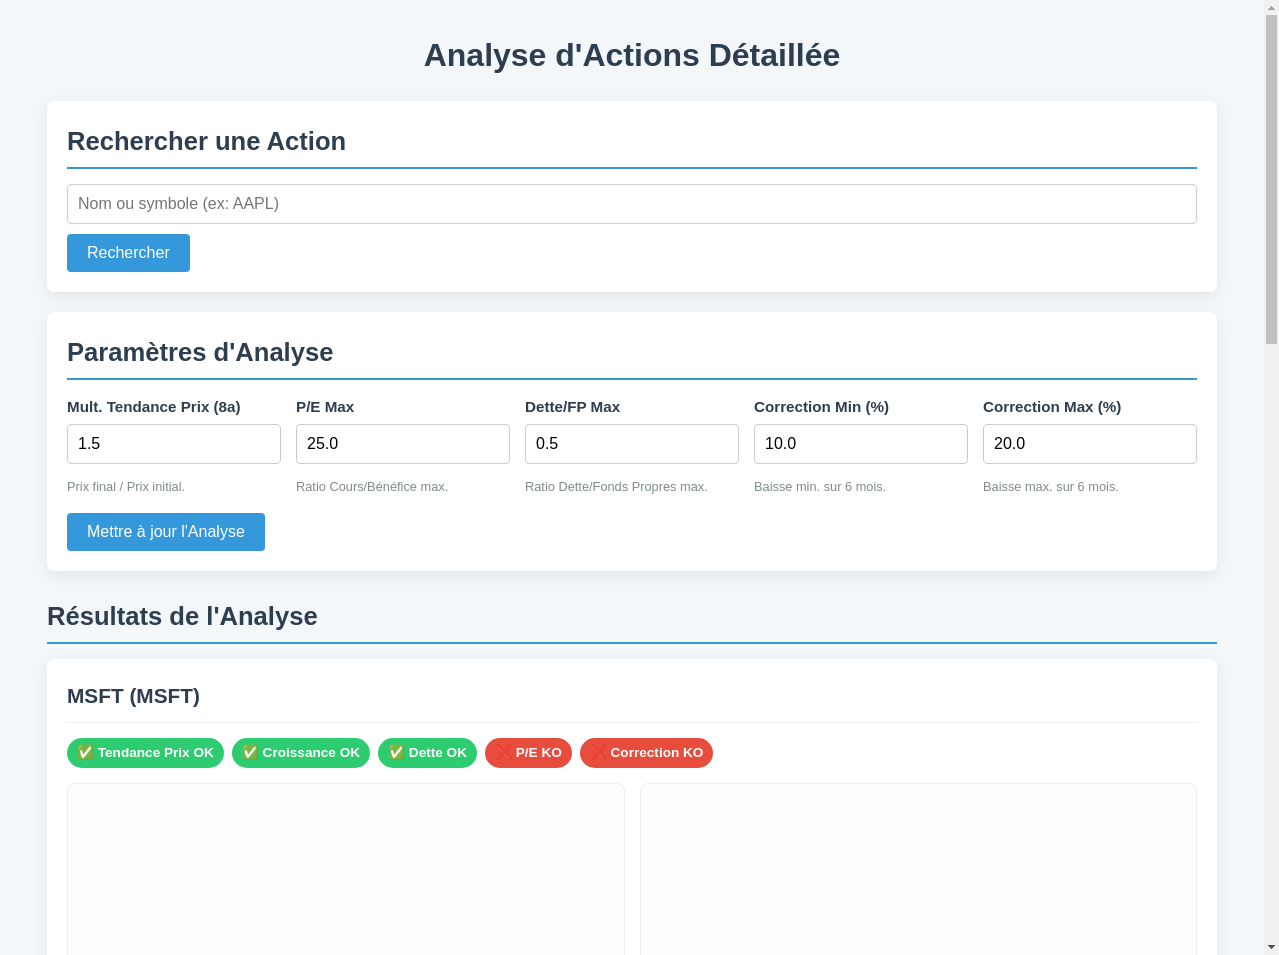
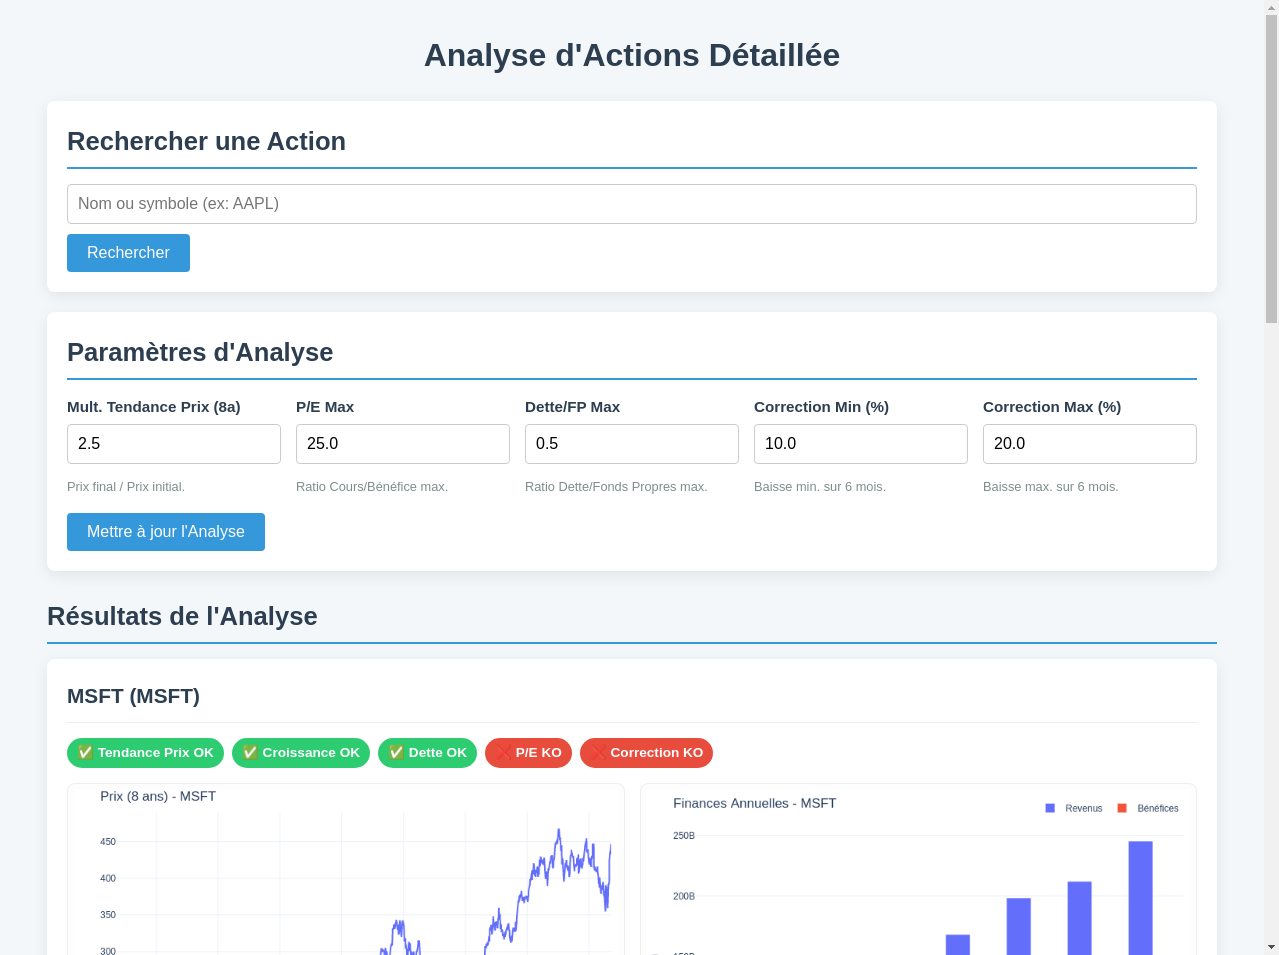
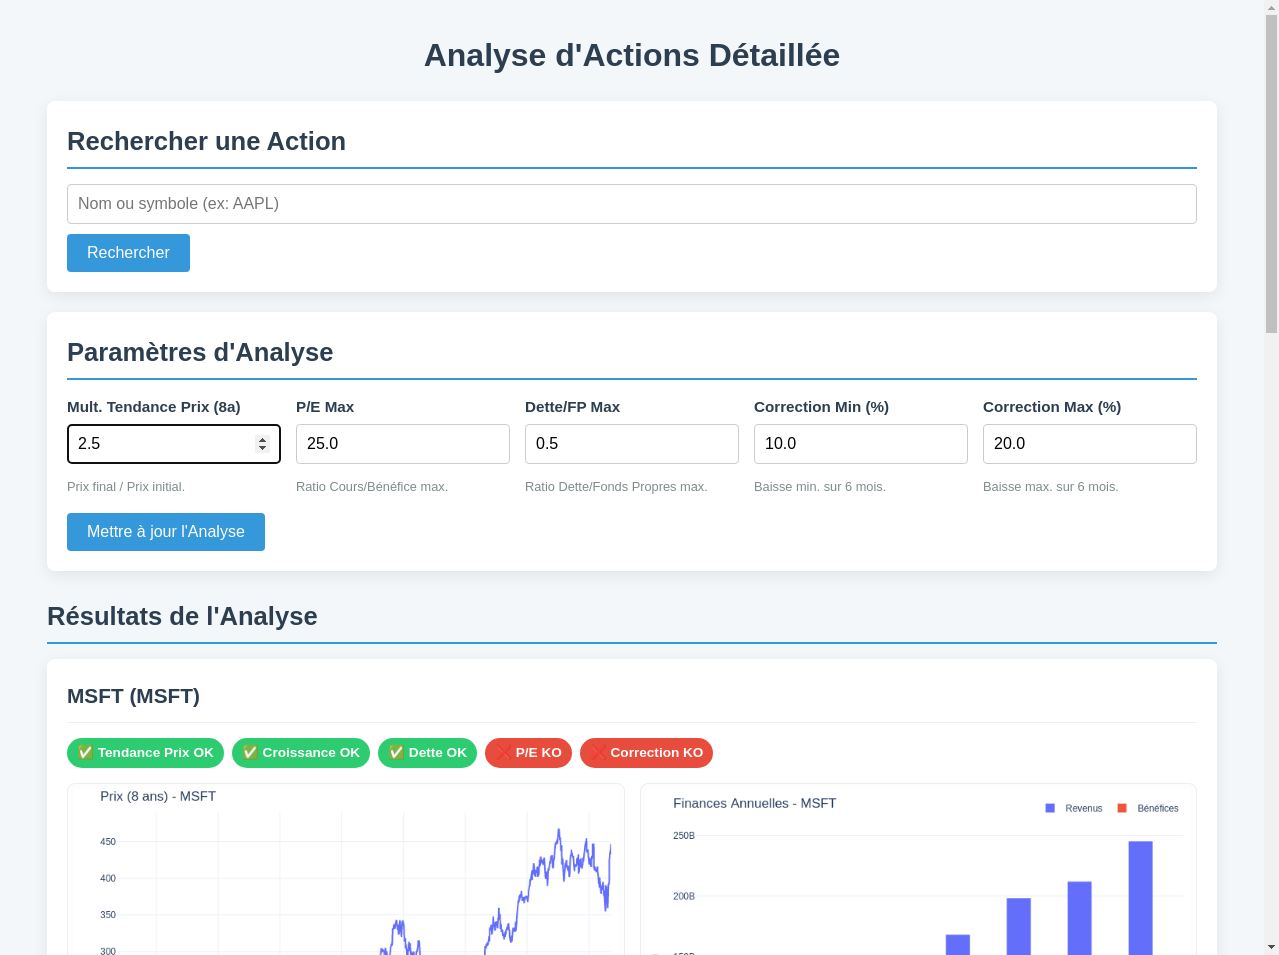
- By default, the "Mult. Trend Price (8a)" might be set at 1.5. To target a more pronounced trend, we decide to adjust it to 2.5. This means we are looking for stocks whose price has been multiplied by at least 2.5 over the last 8 years.
- We then click on "Update Analysis" so that the tool recalculates the indicators with this new threshold.
- Status Badges: We observe the badges at the top of the results. For MSFT, with a "Mult. Trend Price" set to 2.5, we should see "Price Trend OK" (if the price has indeed been multiplied by at least 2.5 over 8 years), "Growth OK" (if revenues and profits have grown), "Debt OK" (if the debt-to-equity ratio is below the threshold). The status of P/E and correction will depend on other thresholds and the current state of the stock.
- Price Chart (8 years): This chart is crucial. For MSFT, we expect to see an overall upward curve, confirming the long-term uptrend. We can observe the different phases of growth, any possible consolidations or minor corrections.
- Annual Financials Chart: This chart shows the evolution of revenues (in blue) and profits (in orange/red) over the same period. Ideally, for a healthy price trend, these two indicators should also show growth.
- Key Details - Price Trend: This section is particularly important. It indicates:
- Global Trend (8 years): It confirms whether the price has been multiplied by at least the threshold we have set (2.5 in our case).
- Annual Price Variations: They allow us to see the dynamics year by year. For example, MSFT could have experienced years of very strong growth and others more moderate.
- Key Details - Financial Growth:
- CAGR Revenues and Profits (8 years): These compound annual growth rates give a measure of the fundamental performance of the company over the long term.
- Growth Status: Confirms if the trend is positive for revenues and profits.
- Annual Figures for Revenues and Net Profits: Allow us to see the raw evolution of these figures.
2. Adjustment of Parameter "Mult. Trend Price (8a)" to Refine Strong Trend Search:
3. Analysis of Results Provided by Investlytic:
After the update, Investlytic presents us with several key pieces of information:
4. Interpretation and Discussion:
In the case of MSFT, with a “Price Trend Multiplier” at 2.5, if the “Price Trend OK” badge displays, it confirms that the stock meets our criterion for a strong upward trend. The analysis of the charts and financial growth figures should corroborate this observation. For example, a CAGR of profits at 19.39% and a CAGR of revenues at 14.23% (figures observed during our tests) are very positive signs that support the price trend.
It is then important to look at other indicators. If the P/E ratio is deemed “KO” (for example, above 25), this could indicate that the stock, although in a strong trend, may have become expensive. This does not invalidate the trend but encourages caution or waiting for a possible correction for a more favorable entry point. Similarly, a reasonable level of debt ("Debt OK") is a reassuring factor.
This example shows how, in just a few clicks and by adjusting a key parameter, Investlytic allows you to filter and quickly analyze a stock from the angle of its long-term price trend, while providing the necessary fundamental context.
Note on Batch Analysis (CSV)
It is important to note that Investlytic (in its version app2.py which we explored previously) also offers the possibility of analyzing multiple stocks in batch via the import of a CSV file containing a list of tickers. Although we have focused here on single-stock analysis for clarity of examples, this feature is extremely powerful for quickly scanning a portfolio or watchlist and identifying at a glance the stocks that meet your trend criteria (and other parameters). The principle remains the same: define your thresholds (including the "Price Trend Multiplier") and the tool will generate a summary report for each stock in the list.
Chapter 4: Beyond the Trend – Combining Signals for an Informed Decision
Identifying a stock in a strong upward trend through a tool like Investlytic is an encouraging first step. However, relying solely on the price trend can be risky. Financial markets are complex, and even the strongest trend is never a guarantee of future success. It is crucial to combine trend analysis with other indicators to make more robust and informed investment decisions.
Why Relying on Trends Alone Is Not Enough
Focusing solely on price trends exposes investors to several pitfalls:
- Bull Traps (Hawkish Traps): A stock may experience a brief and sharp rise (appearing to initiate a trend) that attracts investors before plummeting rapidly. Those who bought at the peak find themselves trapped.
- Bear Traps (Bullish Traps): Conversely, a temporary decline can be mistakenly interpreted as the beginning of a bearish trend, prompting some to sell or short-sell, only for the price to rebound upwards.
- Ignoring Fundamentals: A price trend can sometimes be disconnected from the true health of the company. Speculative factors, rumors, or fleeting enthusiasm can drive up a stock’s price without justifiable increases in earnings or growth prospects. Such trends are often fragile.
- Overvaluation: A stock may be on an extended upward trend to the point of becoming significantly overvalued relative to its intrinsic value (for example, a very high P/E ratio compared to its sector or historical levels). Buying at this stage increases the risk of a painful correction, even if the underlying trend remains positive over the long term.
The Importance of Cross-Analysis
To minimize these risks, it is essential to cross-analyze trends with other types of information:
- Fundamental Indicators:
- P/E Ratio (Price-to-Earnings): As we saw in a previous article, it helps evaluate whether a stock is expensive or cheap relative to its earnings. An upward trend supported by a reasonable P/E ratio is more reassuring.
- Earnings and Revenue Growth: A price trend is stronger if it is driven by continuous growth in the company's results.
- Financial Health (Debt-to-Equity Ratio): A heavily indebted company is more vulnerable to economic shocks, which can weaken its stock trend.
- Profit Margins, Cash Flow, Dividends: Other fundamental indicators can refine the analysis.
- Other Technical Indicators:
- Trading Volumes: An upward trend accompanied by increasing volumes is generally considered stronger. Low volumes during an uptrend may indicate a lack of conviction.
- Support and Resistance Levels: Identifying these key levels can help anticipate turning points or continuations of trends.
- Momentum Indicators (RSI, MACD): These tools can help assess the strength and speed of a trend and detect signs of overbuying or overselling.
How Investlytic Facilitates This Combined Analysis
One of the advantages of Investlytic is that it presents many of these pieces of information in a centralized manner, allowing for an initial combined analysis:
- Integrated Status Badges: At a glance, the "Price Trend OK/NOK", "Growth OK/NOK", "Debt OK/NOK", "P/E OK/NOK", "Correction OK/NOK" badges provide a quick summary that combines several aspects.
- Synchronized Chart Display: The ability to view the price chart alongside the annual revenue and profit charts facilitates correlation between the price trend and fundamental performance.
- Adjustable Parameters: The user can set their own thresholds for P/E, debt, etc., which allows aligning the trend analysis with their own risk tolerance and fundamental investment criteria.
For example, using Investlytic, you could search for stocks that not only have a "Price Trend OK" (with a high price multiplier), but also display "Growth OK", "Debt OK", and a "P/E OK" according to your criteria. This filters out a large number of stocks and directs you towards potentially stronger opportunities.
Tips for a Balanced Investment Strategy Based on Trends
- Use trends as a filter, not as a single decision: Let trends guide you towards interesting stocks, but always deepen the analysis.
- Adapt your time horizon: Trend-based strategies can vary significantly depending on whether you are a short-, medium-, or long-term investor.
- Never neglect risk management: Set stop-loss orders to protect your capital if the trend reverses sharply.
- Diversify: Don’t put all your eggs in one basket, even if several stocks seem to be on promising upward trends.
- Stay informed and continue learning: Markets evolve, tools do too. Continuous education is key to long-term success.
Conclusion: Investlytic, a Lever for Your Trend Strategies
Identifying and following trends is an essential component of many successful investment strategies. While the concept may appear simple, its practical implementation requires analysis, rigor, and the right tools. Investlytic positions itself as a valuable ally in this endeavor, particularly for investors looking to save time and access structured initial analysis.
Thanks to features like the calculation of the "Trend Price Multiplier", the visualization of price and fundamental charts, and the presentation of key criteria in a concise manner, Investlytic demystifies part of trend analysis. It enables rapid filtering of stocks, quantification of past price movement strength, and contextualization with essential financial data.
However, as we have noted, no tool is a crystal ball. Trend analysis, even assisted by Investlytic, must always be complemented by critical judgment, an understanding of the fundamentals of the business, and sound risk management. Use Investlytic as a lever to refine your research and validate your intuitions, but never forget that the final decision to invest is yours and must be the result of thorough reflection.
By integrating the information provided by Investlytic judiciously into a global and prudent investment strategy, you increase your chances of navigating successfully through the sometimes turbulent but often rewarding waves of the financial markets.
Frequently Asked Questions (FAQ) on Identifying Trends with Investlytic
What is a moving average and how does it help in seeing a trend?
A moving average (MA) is a technical indicator that smooths out the fluctuations in the price of a stock by calculating its average price over a defined period (for example, 50 or 200 days). It helps visualize the general direction of the trend: if the price is above an ascending moving average, the trend is generally upward. Investlytic, while not focusing explicitly on moving averages in its primary analysis, provides long-term price charts that allow observing similar dynamics to those revealed by moving averages.
What exactly is the "Mult. Trend Price (8a)" parameter in Investlytic?
The "Mult. Trend Price (8a)" is a key indicator in Investlytic that measures how many times the price of a stock has been multiplied over an 8-year period. For example, a multiplier of 2.0 means the price has doubled. The user can set a threshold for this multiplier to filter stocks based on the strength of their past upward trend. This is a quantitative way to evaluate long-term performance.
Can one rely solely on the trend to buy a stock?
No, it is risky to rely solely on the trend. A strong past trend does not guarantee future performance. It is crucial to combine trend analysis with the study of the company's fundamentals (profit growth, P/E ratio, leverage), as enabled by Investlytic, and other technical indicators to make an informed decision and manage risks.
Can Investlytic predict the duration of a trend?
Investlytic does not predict the future duration of a trend. It analyzes past trends over an 8-year period and provides indicators on the strength and regularity of this historical trend. Predicting the duration of a trend is complex and depends on numerous unpredictable market factors. The tool helps understand past dynamics to inform current decisions.
How does Investlytic help manage false trend breakouts?
Investlytic does not have a specific feature to detect "false trend breaks" in real-time. However, by focusing on long-term trends (8 years) and encouraging correlation with solid fundamentals (revenue/profit growth, controlled debt), it indirectly helps filter price movements that may be less supported and therefore more likely to be false breaks. The combined analysis it offers encourages a broader perspective than just short-term chart observation.