
Stock market investment can seem like a complex universe filled with jargon and technical indicators. Yet, some tools, once well understood, become invaluable allies for navigating financial markets. The Price-to-Earnings (P/E) ratio, or PER (Price Earnings Ratio) in French, is one of these fundamental indicators. Whether you are a beginner investor looking to take your first steps or an enlightened enthusiast wishing to refine your analysis, understanding the P/E ratio is essential. This article aims to demystify the P/E ratio: we will explore its definition, how it is calculated, different ways to interpret it, its inevitable limitations, and how an analysis tool such as Investlytic can help you visualize and use it practically. Get ready to add a crucial string to your bow as an investor!
Understanding the P/E Ratio (Price-to-Earnings): A Beginner’s Guide
When venturing into the world of stock market investment, one quickly encounters a multitude of terms and financial ratios that may seem intimidating at first glance. Among these, the P/E ratio, or Price-to-Earnings ratio (sometimes referred to as PER in French, for Price Earnings Ratio or price-to-earnings ratio), is one of the most frequently cited and used by investors and analysts. But what does this ratio really mean? How is it calculated, and more importantly, how can it help you make more informed investment decisions? This article seeks to demystify the P/E ratio, explain its workings, its various forms, its usefulness in evaluating the costliness of a stock, as well as its limitations.
What is the P/E Ratio? A Simple Definition
The Price-to-Earnings (P/E) ratio is a fundamental financial indicator that relates the share price of a company to its earnings per share (EPS). Essentially, it indicates how much investors are willing to pay for each dollar (or euro, or any other currency) of profit generated by the company. It is often referred to as a "valuation multiple" or "price-to-earnings multiple."
To put it even more simply, the P/E ratio gives you an idea of the relative "costliness" of a stock. A high P/E ratio might suggest that the market has strong expectations for future growth of the company, or that the stock is potentially overvalued. Conversely, a low P/E ratio could indicate that the stock is undervalued, or that the market anticipates difficulties or slow growth for the company. However, as we will see, interpretation is never as binary and requires contextual analysis.
One of the main advantages of the P/E ratio lies in its ability to provide a basis for comparison. It allows evaluating the valuation of a company relative to its own historical performance, compared to other companies in the same industry sector, or even compared to broader market indices such as the S&P 500 or the CAC 40. According to Investopedia, "The P/E ratio is one of the most widely used by investors and analysts reviewing a stock's relative valuation. It helps to determine whether a stock is overvalued or undervalued." [1]. The Stock Market Cafe also emphasizes its importance by describing it as "a very commonly used indicator by equity investors to evaluate the value of companies, often with the aim of finding investment opportunities" [2].
@maxime.fsr 📊 Apple : solid company... but is the stock too expensive? Discover the P/E ratio and why it can alert you when it exceeds 25. 💡 Educational content only. Always do your own research. #bourse #action #apple ♬ Sweet Tooth - Cavetown
How to Calculate the P/E Ratio? The Formula Explained
The calculation of the P/E ratio is relatively simple and straightforward. The formula is as follows:
P/E Ratio = Stock Price / Earnings Per Share (EPS)
Let's break down the two components of this formula:
- Stock Price (P - Price): This refers to the current price of a single share of the company on the stock market. This information is easily available on any financial platform or stock website by searching for the ticker (stock symbol) of the company.
- Earnings Per Share (EPS or E - Earnings): EPS represents the portion of the company's net profit that is attributable to each outstanding common share. It is calculated by dividing the company's net profit (after taxes and after payment of preferred dividends, if any) by the total number of outstanding common shares. Therefore, the formula for EPS is: EPS = (Net Profit - Preferred Dividends) / Weighted Average Number of Outstanding Common Shares.
Earnings per share is a critical metric as it reflects the profitability of a company on a per-share basis. Companies typically publish their EPS during their quarterly and annual financial reports. It is important to note that there are several ways to consider EPS for calculating the P/E ratio, which leads to different variants of the ratio, as we will explore further.
For example, if a company's stock trades at €50 and its EPS over the last twelve months is €2.50, then its P/E ratio would be 50 / 2.50 = 20. This means that investors are paying €20 for each euro of profit that the company has generated over the past year. In other words, it would theoretically take 20 years of profits at the current level for the company to "repay" the price of its stock, assuming all profits are distributed and EPS remains constant.
Understanding this formula is the first step towards being able to interpret and use the P/E ratio effectively in your analysis.
The Various Flavors of the P/E Ratio: Understanding the Nuances
As mentioned earlier, the "E" (earnings) part of the P/E ratio can be calculated in different ways, leading to several variants of the ratio. It is crucial to understand these distinctions, as they can significantly influence the value of the P/E ratio and its interpretation. The two most common variants are the trailing P/E (or P/E TTM) and the forward P/E (or estimated P/E).
1. The Trailing P/E (P/E TTM - Trailing Twelve Months)
The trailing P/E, often noted as P/E TTM, is calculated using the earnings per share realized by the company over the past twelve months (typically the sum of EPS from the four most recent published quarters). This is the most commonly encountered form of P/E and is often considered more objective because it is based on real and verified historical data. Investopedia notes that “It’s the most popular P/E metric because it’s thought to be objective—assuming the company reported earnings accurately.” (This is the most popular P/E metric because it is considered objective, assuming the company reported earnings accurately.) [1].
The advantage of the P/E TTM is its reliability, as it relies on concrete figures. However, its main disadvantage is that it reflects the past and does not account for the future prospects of the company, which are essential drivers of investment decisions. Past performance, while informative, is not always indicative of future results.
2. The Forward P/E (Estimated P/E or Leading P/E)
The forward P/E, or estimated P/E, is calculated using anticipated future earnings per share, generally for the next twelve months. These earnings estimates usually come from analysts' consensus analyses who follow the company, or sometimes from forecasts provided by the company itself (though this is rarer and should be taken with caution).
The forward P/E ratio’s interest lies in its focus on the future, which can be more relevant for investors looking to anticipate future performance. If the forward P/E is lower than the trailing P/E, it suggests that analysts expect earnings growth. Conversely, a higher forward P/E compared to the trailing P/E may indicate an expectation of declining earnings. However, the forward P/E relies on estimates, which are inherently uncertain and may prove incorrect. Companies may sometimes under-predict their forecasts to later "beat" them, or analysts may misjudge their models.
3. The Shiller P/E (or CAPE Ratio)
Another variant, less common for individual stock analysis but important for long-term market analysis, is the Shiller P/E, also known as the CAPE (Cyclically Adjusted Price-to-Earnings) Ratio. Developed by Nobel laureate Robert Shiller, this ratio uses the average of real earnings over the past ten years, adjusted for inflation, in the denominator. The goal is to smooth out cyclical fluctuations in earnings over a longer period and provide a more stable view of valuation. The Coffeehouse mentions that "In conclusion, there is also a final version of the P/E Ratio. It is the Shiller P/E (created by Professor Robert Shiller), which uses an average of the earnings of the last ten years in the calculation of the P/E." [2].
It is therefore essential, when consulting a P/E ratio, to check which method of calculating earnings has been used (trailing, forward, etc.) to interpret it correctly.
How to Interpret the P/E Ratio? What It Tells You (and Does Not Tell You)
Interpreting the P/E ratio is not an exact science and requires discernment. A "good" or "bad" P/E does not exist in absolute terms. Its meaning depends heavily on the context, including the industry sector of the company, its growth prospects, prevailing interest rates, and the general market sentiment.
A High P/E: Sign of Overvaluation or Strong Expectations?
A high P/E ratio indicates that investors are willing to pay a high price for each unit of earnings. Several reasons can explain this:
- Strong expectations for future growth: This is often the case for growth companies, particularly in technology or innovative sectors. Investors anticipate significant increases in future earnings, justifying a higher multiple today.
- Quality and Stability: Companies perceived as having durable competitive advantages, solid management, or very stable and predictable earnings may also command higher P/Es.
- Overvaluation: A high P/E can also simply mean that the stock is overvalued relative to its current fundamentals and reasonable prospects. This could be a sign of a speculative bubble or excessive market optimism.
A Low P/E: Buying Opportunity or Value Trap?
Conversely, a low P/E ratio suggests that the market is paying a relatively low price for the company’s earnings. The reasons may include:
- Undervaluation: The stock may be temporarily overlooked by the market or misunderstood, offering potentially a buying opportunity if the company's fundamentals are solid.
- Low growth prospects: The market may anticipate a stagnation or decline in future profits. This is often the case for mature companies in low-growth sectors.
- High risks: The company may face specific difficulties (high debt levels, management issues, increased competition, etc.) which weigh on investor perceptions.
- Specific industry: Some sectors, such as community services or certain cyclical industries, tend to have structurally lower P/E ratios.
The Importance of Comparison
To make sense of a company’s P/E ratio, it is crucial to compare it:
- To the historical P/E ratio of the company itself: This allows seeing whether the stock is currently more expensive or cheaper compared to its past average.
- To the P/E ratios of comparable companies within the same sector: Comparing a bank with a technology firm using solely the P/E ratio does not make much sense, as their economic models and growth profiles are very different. Apples should be compared with apples.
- To the average P/E ratio of the market or a reference index (for example, the S&P 500 or the CAC 40): This gives an indication of the valuation of the company relative to the market as a whole.
The Stock Market Café offers general interpretation ranges while emphasizing that they should be taken with caution: “Less than 7: stocks of troubled companies… Between 7 and 12: stocks of disliked companies… Between 12 and 25: stocks of solid companies… More than 25: …stocks of growing companies benefiting from a dominant position or speculative bubble.” [2]. They also remind us that Benjamin Graham, Warren Buffett’s mentor, considered a P/E ratio above 12 as a risky investment in the 1950s, highlighting the evolution of markets.
The P/E Ratio and Negative Earnings
It is important to note that a company that does not generate earnings (i.e., records losses) will not have a meaningful P/E ratio, or it will be shown as "N/A" (not applicable). Indeed, dividing a price by a negative or zero profit does not provide a useful indicator for valuation in this context. For these companies, other ratios, such as the Price-to-Sales (Price/Sales), may be more relevant.
The Limits of the P/E Ratio: What to Keep in Mind
While the P/E ratio is a valuable and widely used tool, it is essential to know its limitations to avoid erroneous interpretations or hasty investment decisions. No financial ratio should be used in isolation, and the P/E ratio is no exception.
1. Sectorial Differences and Economic Models
As mentioned previously, the "normal" levels of P/E ratios vary considerably from one sector to another. High-growth technology companies often have much higher P/E ratios than utility companies or banks, which are generally more mature and have more modest growth prospects. Comparing the P/E ratio of one company to another operating in a different sector can therefore be misleading. It is imperative to compare companies within the same sector or with similar economic models.
2. Profit Manipulation and Quality of Earnings
The "E" (Earnings) in the P/E ratio is based on the profits declared by the company. However, accounting rules offer some flexibility, and companies may sometimes use accounting methods (perfectly legal) to smooth out their profits, temporarily inflate them, or present them in a more favorable light. Exceptional items (non-recurring gains or losses) can also distort the EPS and thus the P/E ratio for a given period. It is therefore crucial to question the "quality" of the earnings: are they recurring, sustainable, and truly reflective of the operational performance of the company? A more thorough analysis of the financial statements is often necessary.
3. Impact of Debt
The P/E ratio does not directly account for the level of debt of a company. Two companies with similar P/E ratios may have very different risk profiles if one is heavily indebted and the other is not. A highly leveraged company may show a higher EPS during good times due to financial leverage, but it will also be more vulnerable during an economic slowdown or an increase in interest rates. Other ratios, such as the Debt/Equity ratio or the EV/EBITDA (Enterprise Value/Adjusted Operating Income), can complement the analysis by incorporating the capital structure.
4. Negative or Zero Profits
As we have seen, the P/E ratio is not calculable or meaningful for companies that record losses. This limits its usefulness for evaluating young start-up companies, turnaround companies, or those operating in highly cyclical sectors going through a downturn.
5. Uncaptured Growth Prospects
Although a high P/E ratio may reflect expectations of growth, the ratio itself does not quantify this growth. For this purpose, other indicators such as the PEG ratio (Price/Earnings to Growth) are often used. The PEG ratio divides the P/E ratio by the expected growth rate of earnings. A PEG ratio below 1 is often considered a potential sign of undervaluation for a growth company.
6. Volatility of Stock Prices and Earnings
The stock price (the numerator of the P/E ratio) can be very volatile, constantly changing based on market sentiment. Similarly, earnings (the denominator) can fluctuate, especially for cyclical companies. This means that the P/E ratio can change rapidly, and it is important not to base decisions solely on a single value without considering the trend and stability of both components.
Investopedia highlights this limitation well: "However, no ratio can tell you everything you need about a stock. Before investing, it's wise to use a variety of ratios to get a fuller picture of a company's financial health and valuation." [1].
Beyond the P/E Ratio: Other Considerations and Additional Ratios
For a robust investment analysis, the P/E ratio should be integrated into a broader approach. Here are some additional elements to consider:
- The General Economic Context: Average market P/E levels tend to be higher during periods of low interest rates and strong economic growth, and vice versa.
- The Company's Strategy and Competitive Advantages: Understanding the company's business model, its market position, competitive advantages (moat), and long-term strategy is fundamental.
- The Quality of Management: A competent and ethical management team is a major asset.
- Cash Flows: Accounting profits are one thing, real cash flows are another. Analyzing available free cash flow can provide a more accurate picture of the company's ability to generate value.
- Other Financial Ratios: In addition to the P/E ratio, other useful ratios include:
- PEG Ratio (Price/Earnings to Growth): Compares the P/E ratio to expected earnings growth.
- PS Ratio (Price to Sales): Stock price / sales per share. Useful for companies without earnings.
- PB Ratio (Price to Book Value): Stock price / book value per share. Often used for financial companies.
- Dividend Yield: Annual dividend per share / stock price. Important for investors seeking income.
- EV/EBITDA Ratio (Enterprise Value to Earnings Before Interest, Taxes, Depreciation, and Amortization): Compares the total enterprise value (market capitalization + net debt) to earnings before interest, taxes, depreciation, and amortization. Often considered less susceptible to accounting manipulation than the P/E ratio.
In conclusion of this section, the P/E ratio is an excellent starting point to evaluate the valuation of a stock, but it should never be the sole criterion for decision-making. A thorough analysis requires understanding its limitations and complementing it with other qualitative and quantitative information. It is by cross-referencing sources and indicators that one can form an informed opinion.
The P/E Ratio in Practice: How Investlytic Can Enlighten You (Illustrated)
Now that we have explored the theory behind the P/E ratio, its nuances, and its limitations, let's see how an analysis tool like Investlytic can practically help you use and interpret it in your stock selection process. The goal of Investlytic, as revealed through the analysis of its components and interface, is to simplify access to key financial data and provide an initial layer of educational analysis, including around the P/E ratio, for a single stock or a list of stocks.
Analysis of a Single Stock with Investlytic: The Example of Apple (AAPL)
To illustrate the workings of Investlytic, we will simulate the analysis of Apple Inc.'s stock (symbol: AAPL). The tool allows searching for a stock by name or symbol and then displaying a detailed analysis.
- Stock Search and Analysis Parameters The initial interface of Investlytic for analyzing a single stock is clear and intuitive. The user is prompted to enter the name or symbol of the stock in a search field. Below, analysis parameters are predefined but can be adjusted by the user. These parameters include thresholds for price trend, maximum P/E ratio, maximum Debt/Equity ratio, and price correction ranges.
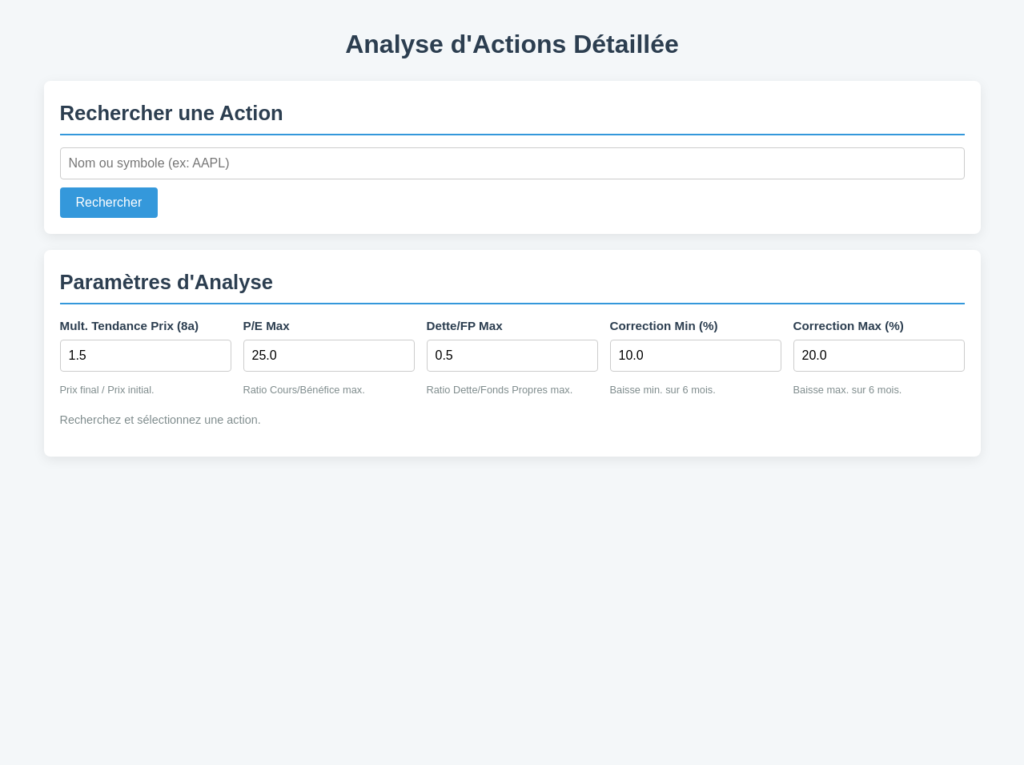
Investlytic search interface with analysis parameters visible.
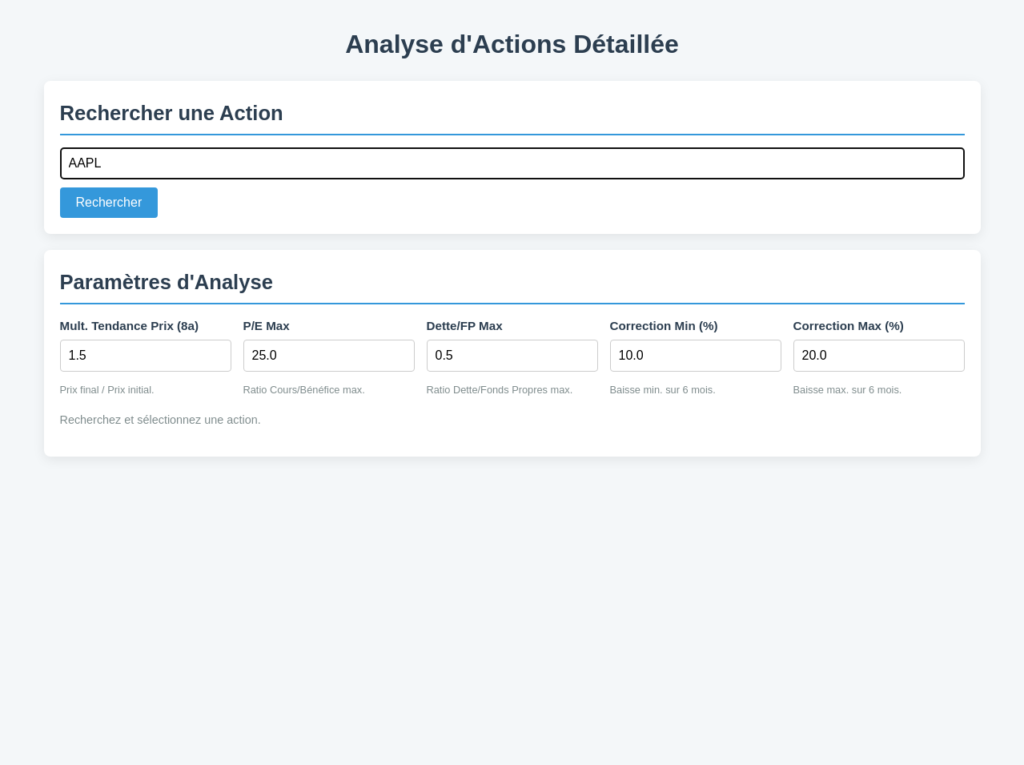
Search field filled with “AAPL”.
After entering "AAPL" and clicking "Search", Investlytic provides a list of matches to ensure the user selects the correct entity.
List of search results for “AAPL”, with “AAPL - Apple Inc.” at the top.
- Displaying Analysis Results for AAPL Once “AAPL - Apple Inc.” is selected, Investlytic loads and displays the analysis results. This section is particularly rich and highlights key points regarding the P/E ratio.
- Key Indicators and Status of P/E: At the top of the results, visual indicators (such as colored pills or icons) provide a quick overview of the stock's performance relative to defined criteria. For AAPL, one might see indicators like “✅ Price Trend OK”, “✅ Growth OK”, but potentially “❌ P/E KO” if the current P/E exceeds the threshold of 25 set in the settings.
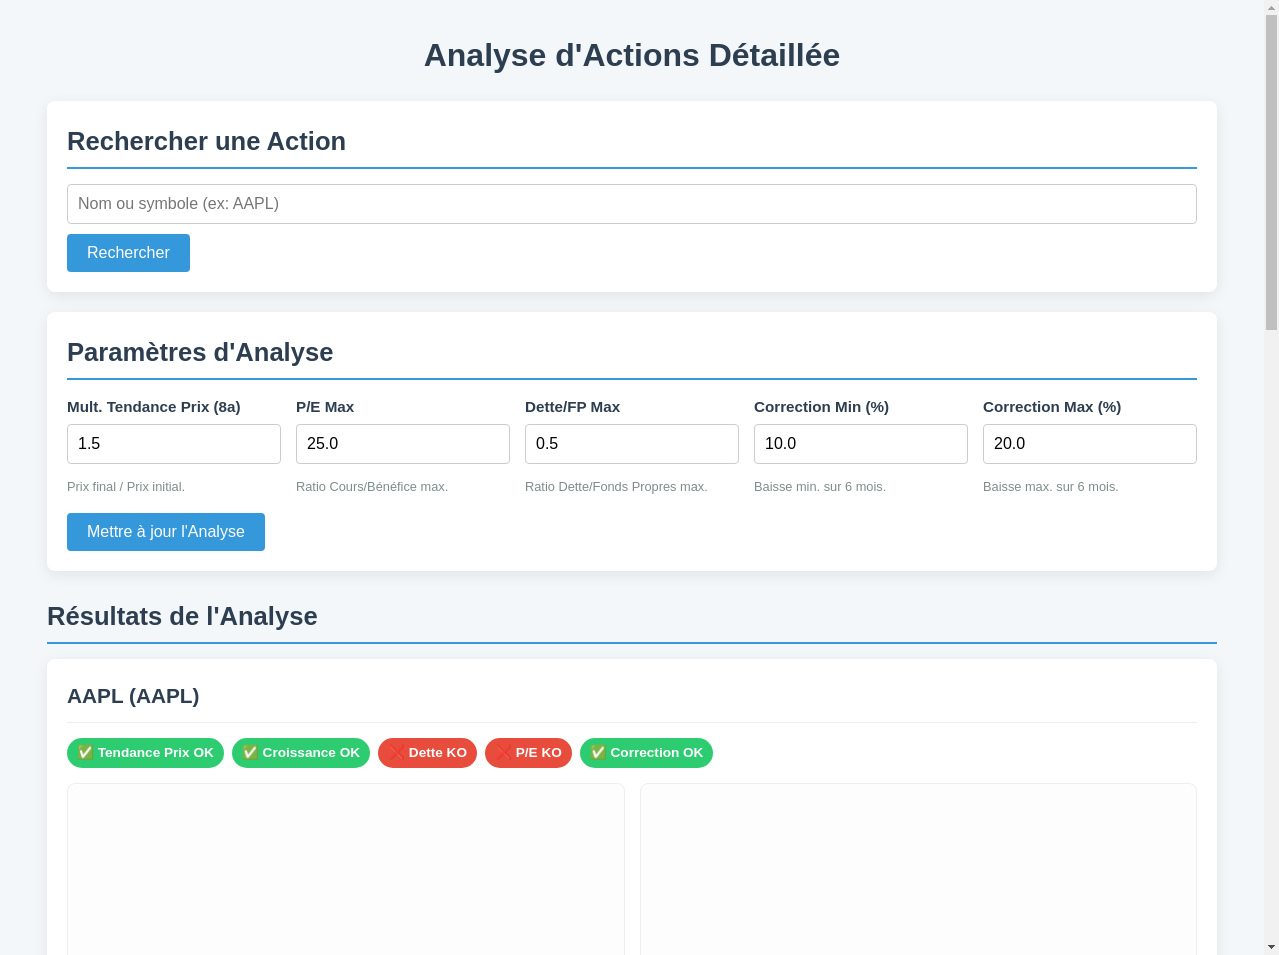 “Analysis Results” section for AAPL, showing visual performance indicators.Contextual Graphs: Investlytic then presents essential graphs to contextualize the P/E. Typically, one finds:
- Key Indicators and Status of P/E: At the top of the results, visual indicators (such as colored pills or icons) provide a quick overview of the stock's performance relative to defined criteria. For AAPL, one might see indicators like “✅ Price Trend OK”, “✅ Growth OK”, but potentially “❌ P/E KO” if the current P/E exceeds the threshold of 25 set in the settings.
- A Historical Price Chart (8 years): This chart shows the evolution of the stock price over a long period, allowing to identify underlying trends, peaks, and troughs.A Revenue and Annual Profit Chart: This chart illustrates the growth (or lack thereof) of revenues and profits of the company over several years. Solid profit growth can justify a higher P/E ratio.
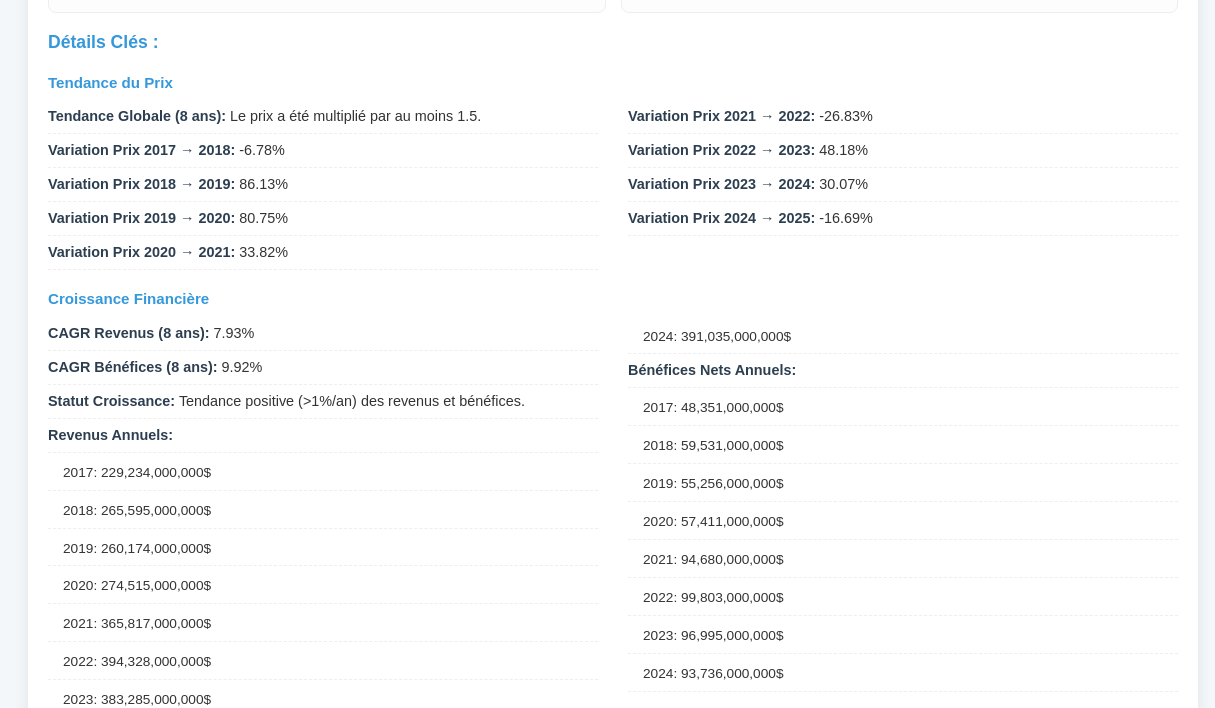 Charts showing the historical price and annual revenue/profits for AAPL, as well as key details.Key Details and Valuation : Further down the page, Investlytic provides precise figures, including the Current P/E Ratio. For example, for AAPL, it might display “Current P/E Ratio: 34.14”. Next to it, a status like “P/E Status: (34.14) >= Limit (25.0). Potentially expensive stock.” is displayed, based on the analysis parameters.
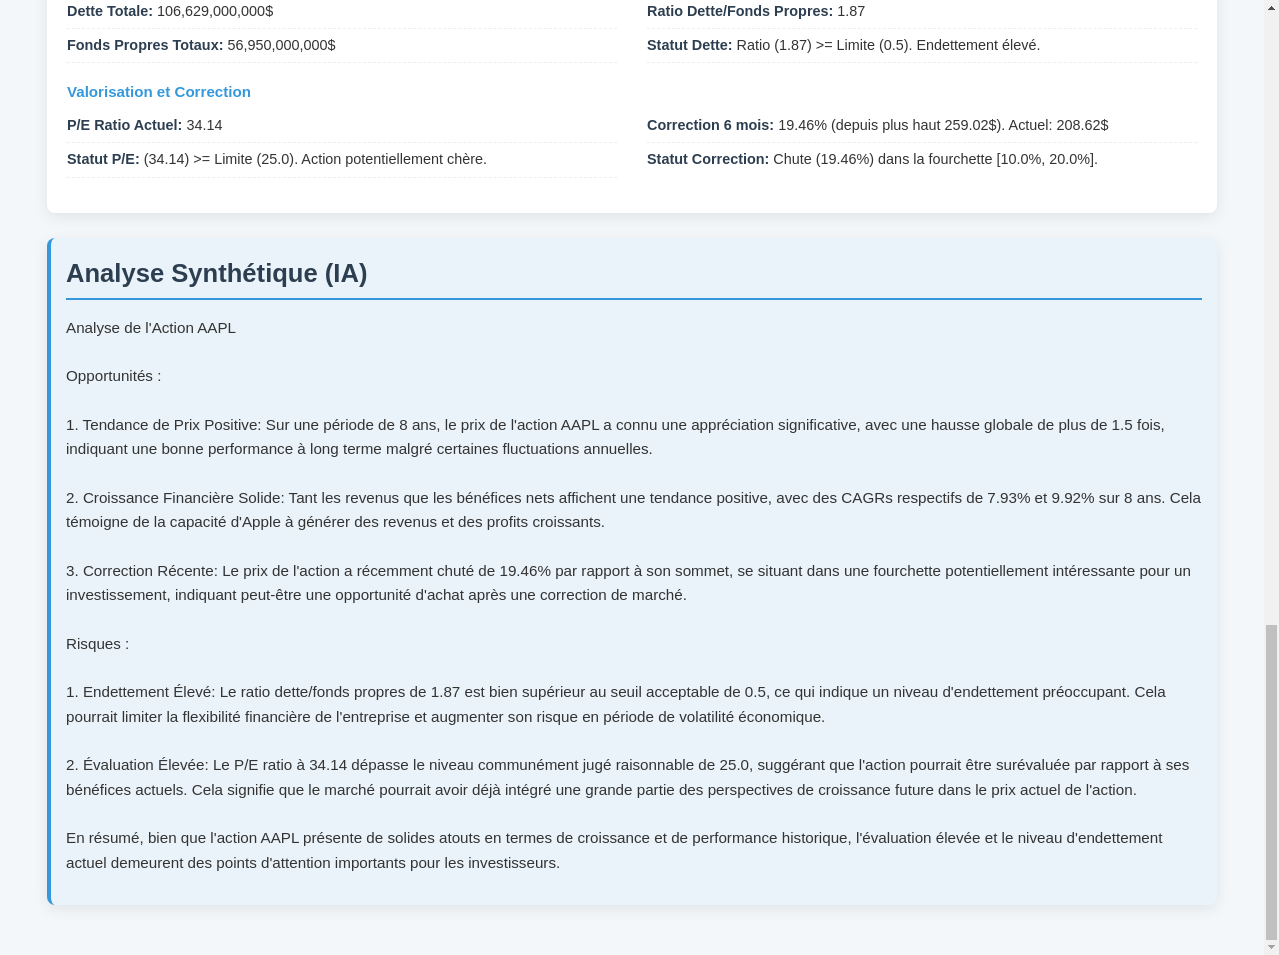 "Valuation and Correction" section and "Synthetic Analysis (AI)" for AAPL in Investlytic.and an example of AAPL analysis with Investlytic shows how the tool does more than calculate the P/E ratio, but puts it into context with other indicators, charts, customizable thresholds, and textual analysis, thus providing valuable assistance, especially for novice investors.
Go Further with Investlytic: Batch Analysis and Trending Stocks
One of the strengths of Investlytic also lies in its ability to process information for multiple stocks simultaneously and help identify opportunities.
- Batch Analysis via CSV File : As mentioned by the user, Investlytic (in one of its versions) allows analyzing multiple stocks at once by importing a CSV file containing a list of stock symbols. The tool then applies the same analysis parameters to each stock in the list and generates a consolidated report. This represents a significant time-saving for investors who follow a diversified portfolio or wish to scan a wide universe of stocks.
- Identify Trending Stocks : By combining different analysis criteria (long-term price trend, profit growth, reasonable P/E, controlled debt, recent price correction), Investlytic implicitly helps identify "trending stocks" or stocks that exhibit potentially interesting characteristics for investment. The synthetic AI analysis may also point to stocks with solid fundamentals and valuation that is not excessive, or which have recently experienced a correction that could offer an entry point.
In summary, Investlytic positions itself as an educational and practical tool. It makes the P/E ratio and other financial concepts more accessible through clear visualizations and contextual analysis. Whether for a deep analysis of a single stock or a broader sweep of the market, it offers useful features to illuminate investment decisions.
Conclusion: The P/E Ratio, An Essential Tool but Not the Only One
The price-to-earnings ratio is undoubtedly one of the most popular and useful tools in an investor's toolkit. It provides a quick and relatively simple way to evaluate the cost of a stock and compare it to others or its own historical performance. Understanding its formula, its variants (trailing, forward), and the factors that influence its level is a key skill for anyone wishing to invest thoughtfully in the stock market.
However, as we have highlighted throughout this article, the P/E ratio is not a magic wand. Its interpretation requires context, comparison with sector peers, and awareness of its limitations. Factors such as the quality of earnings, the level of corporate debt, and especially the company’s future growth prospects must be taken into account. A high P/E ratio does not always mean overvaluation, just as a low P/E ratio does not necessarily indicate a good deal.
Tools like Investlytic can greatly facilitate access and initial interpretation of this ratio and other financial data, particularly for novice investors, by automating calculations and offering clear visualizations and concise analyses. They save time and structure the analysis, whether for a specific stock or a set of stocks.
Ultimately, the P/E ratio is an excellent starting point for your fundamental analysis, but it should always be used in conjunction with other ratios, a qualitative analysis of the company (its business model, management, competitive advantages), and an understanding of the broader economic context. It is this holistic approach that will allow you to make more informed investment decisions and, hopefully, more fruitful ones.
References
[1] Fernando, J. (2024). Price-to-Earnings (P/E) Ratio: Definition, Formula, and Examples. Investopedia. Available at: https://www.investopedia.com/terms/p/price-earningsratio.asp (Accessed May 12, 2025).
[2] Raffard, M. (2023). The P/E Ratio (Price Earnings Ratio or PER): How to Use It? Café de la Bourse. Available at: https://www.cafedelabourse.com/bourse/pe-ratio-per (Accessed May 12, 2025).
Frequently Asked Questions (FAQ) about the P/E Ratio
What is the P/E ratio and why is it important?
The Price-to-Earnings (P/E) ratio compares a company's stock price to its earnings per share (EPS). It indicates how much investors are willing to pay for each unit of profit. This is a key indicator for evaluating whether a stock is potentially overvalued or undervalued and for comparing it to other companies in the same sector or to its historical performance.
How is the P/E ratio calculated?
The P/E ratio is calculated by dividing the Current Stock Price by the Earnings Per Share (EPS). For example, if a stock costs €100 and its EPS is €5, the P/E ratio is 20 (100 / 5 = 20).
Is a high P/E ratio always a bad sign?
Not necessarily. A high P/E ratio can indicate that investors have strong expectations for future growth of the company. However, it may also mean that the stock is overvalued. It is crucial to compare the P/E ratio to the company’s sector, expected growth, and other indicators.
What does a low P/E ratio signify?
A low P/E ratio may suggest that a stock is undervalued, offering a potential buying opportunity. However, this could also reflect low growth prospects, specific risks to the company, or sector issues. A more thorough analysis is always necessary.
What are the main limitations of the P/E ratio?
The P/E ratio should not be used in isolation. Its limitations include: sector differences (P/E ratios vary greatly from one sector to another), the possibility of earnings manipulation, the fact that it does not take debt into account, and its inapplicability to loss-making companies. It is also sensitive to volatility in prices and earnings.
What is the difference between trailing P/E and forward P/E?
The trailing P/E (or TTM) uses past earnings (from the last 12 months) and is based on actual data. The forward P/E uses estimated future earnings by analysts. The forward P/E is more forward-looking but relies on estimates, so it may be less reliable.
How can a tool like Investlytic help in analyzing the P/E ratio?
Investlytic can help by automatically calculating the P/E ratio, comparing it to user-defined thresholds, contextualizing it with charts (price evolution, revenue/profit growth), and providing a summary analysis that takes the P/E ratio into account among other criteria. This simplifies access to information and initial interpretation, especially for beginners.